
Data insights to scale support performance
Use customer experience, support performance and bot/automation data to identify issues and gaps in support delivery. Understand your operations deeply and identify areas of improvement for both your human and automated services Easy-to-use statistics from customizable dashboards give you actionable insights

Build data-driven customer Service center
With data insights, you can:
- Monitor your service performance
- Make your agents more productive
- Measure your customer experiences
- Ensure that automations are effective
- Identify areas for resolving issues faster
Insights to increase performance without adding Costs
(Live, Curated & Customized)
Surface performance insights for all aspects of your support operations using the visualization widgets to make the data easily understandable
On-Demand & Scheduled Reports
Run these standard reports or have them delivered via email to understand your support performance and take corrective actions.
Revenue Statistics
See the revenues brought in by support functions, identify customer interactions that build relationships and drive sales
Automation & Bot Performance
View performance summaries and dive into details to manage your automated services.
Conversational Intelligence
Understand the effectiveness of your AI solutions, where it is working well and what is getting missed.

Using Data Analytics Platform
Collection of detailed operational, messaging, automation and data from integrations that are constantly collected and stored for your analytics tools
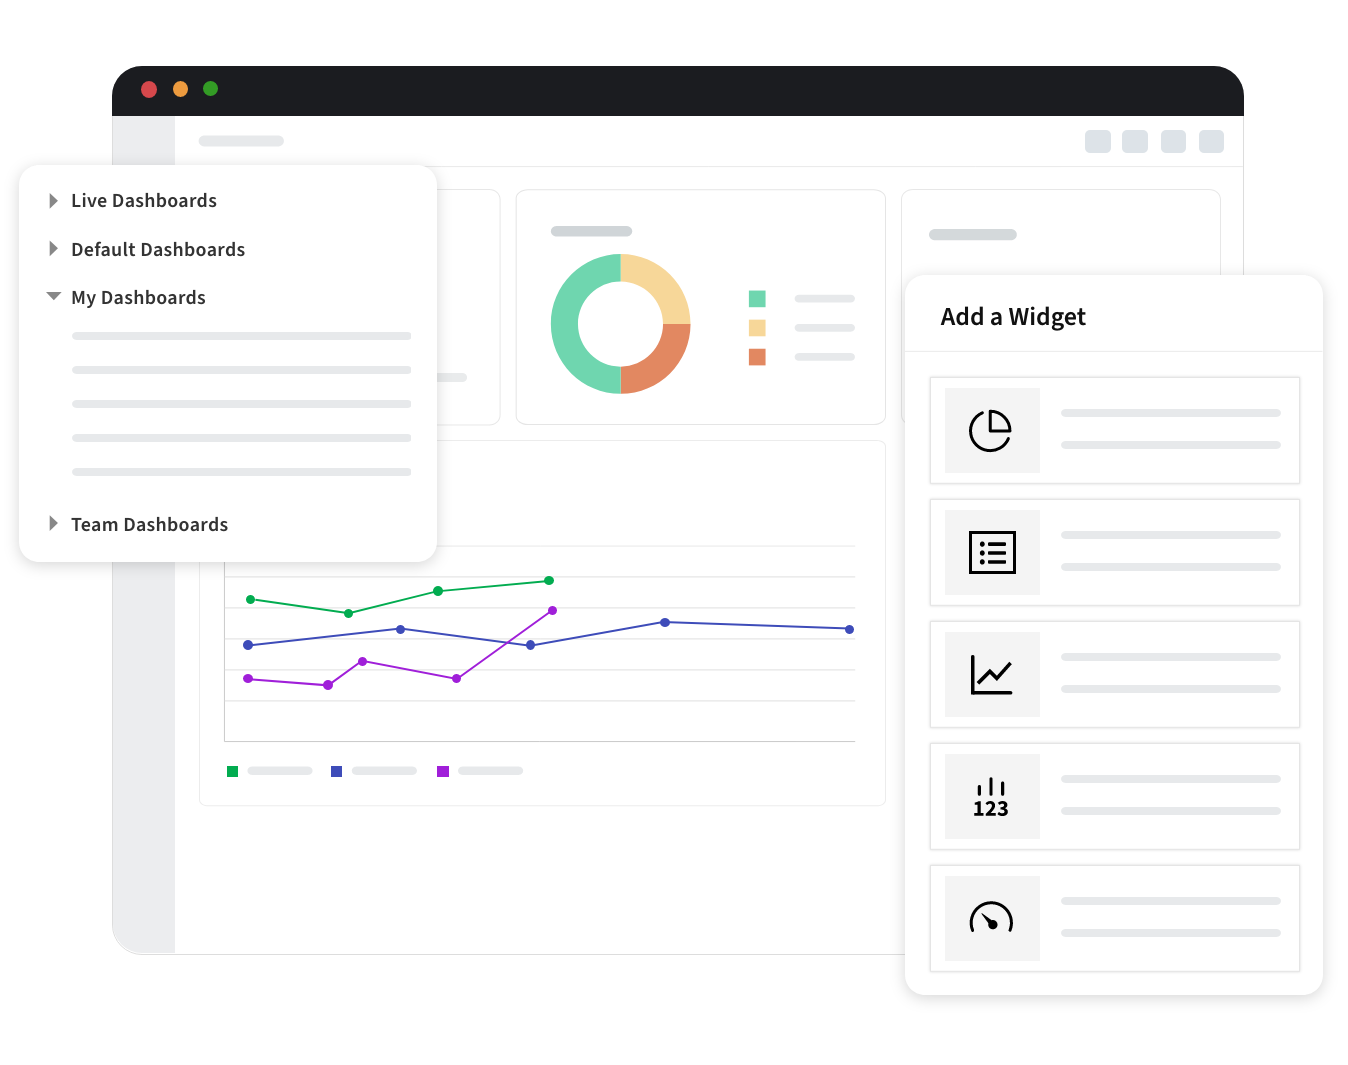
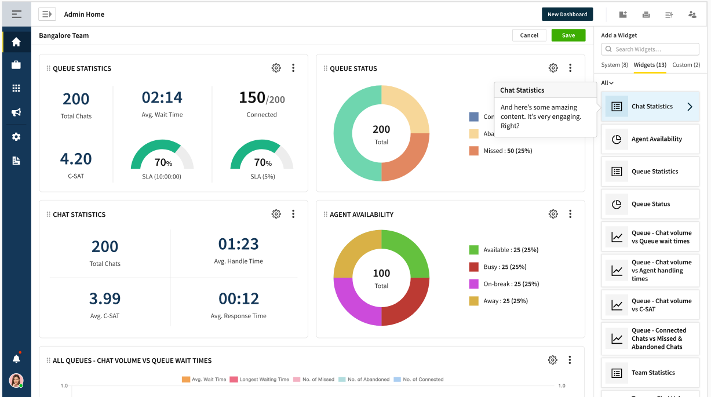
Visualize Performance with Dashboards
Create from Widgets Library

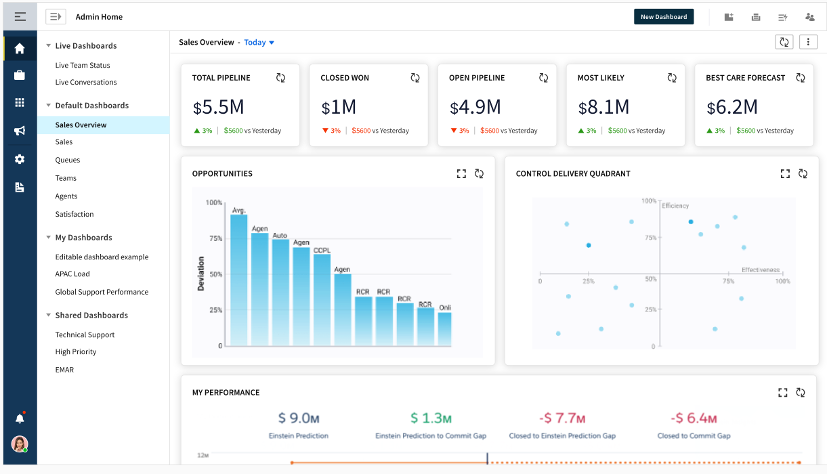
Live Dashboards
Monitor all active conversations and on-line agents and react to issues in real-time

Default Dashboards
Use curated collection of reports to understand and gain insights into all aspects of your customer service operation

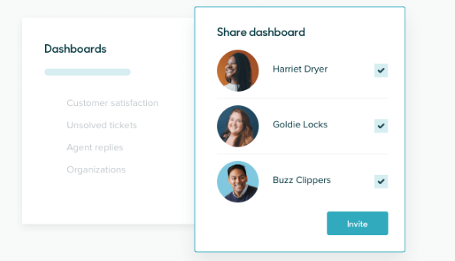
Customized Dashboards
Leverage the analytics data platform to build reports for your specific business needs and share with team members

Team Dashboards
Let your agents make data-driven decisions to improve performance by sharing customized dashboards

Widgets Library
Pre-build data visualization components that can be simply added to create your dashboards

Drag & Drop Designer
Send files, images by dragging and dropping in the rich-text send box. Copy & paste also works

Smart Filter
With smart filters you can pull the required operational and integration data

Calculated Data Values
Create sums, averages and totals are required for display in the widgets
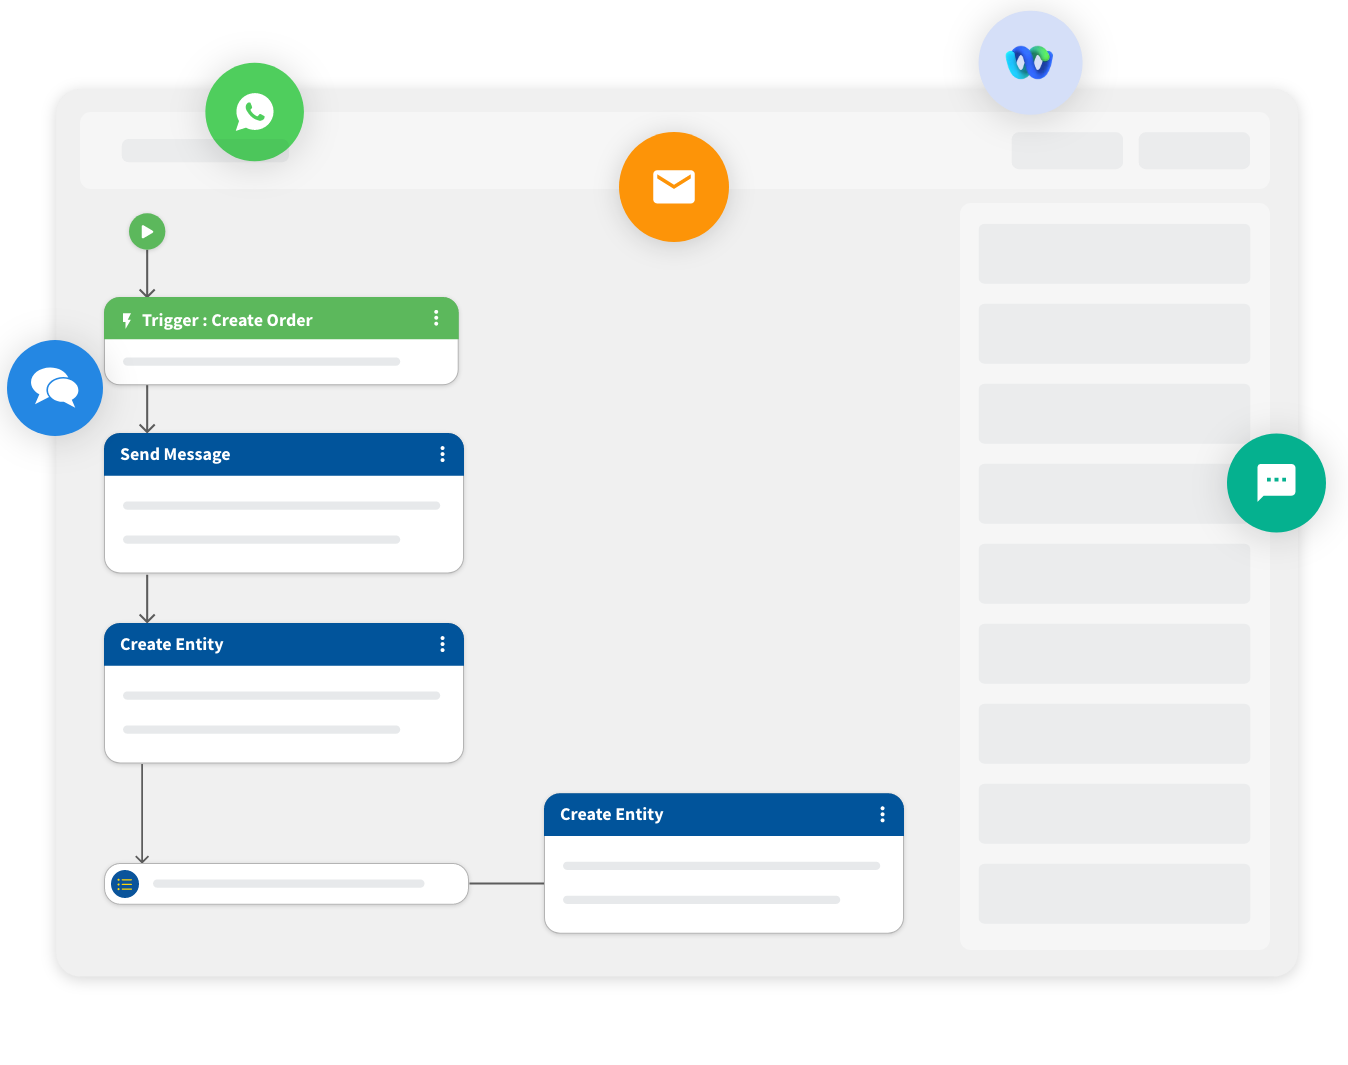
View & act on conversations and active agents in real-time
Live Dashboards
- Monitor all active conversation journeys from origination, queuing, routing to agents and completion
- Manage the on-line agent providing support – who is there and what are they working on
- Both human agents and bot conversations can be monitored by the supervisors
- Actively intercede as needed for training or operation by listening in on conversations and joining them if needed

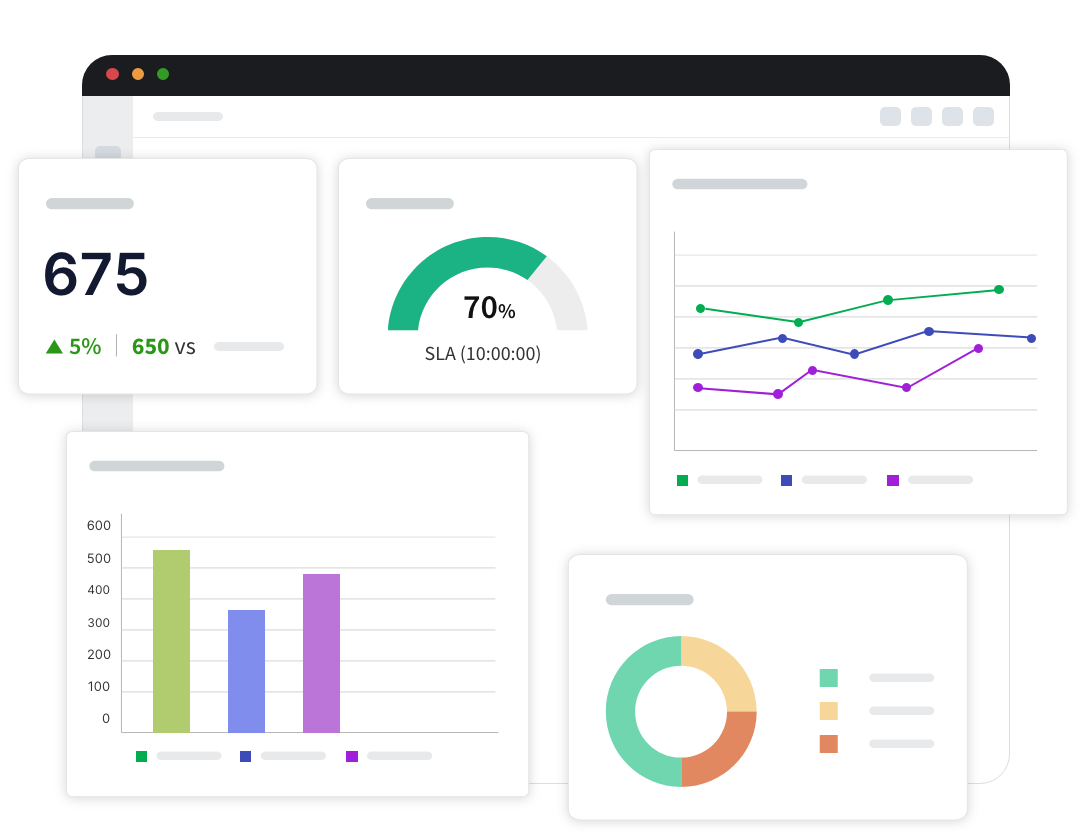
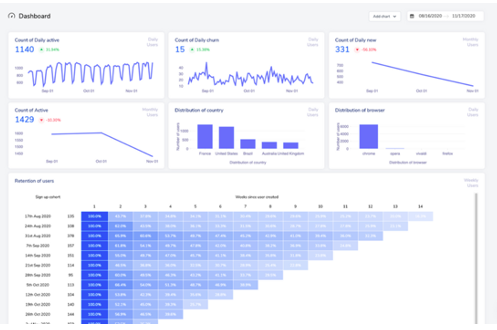
Get instant view of your helpdesk performance
Key metrics for your handling of support requests
Statistics for ticket handling including new issues, open and resolved; handling response times and summary of customer satisfaction
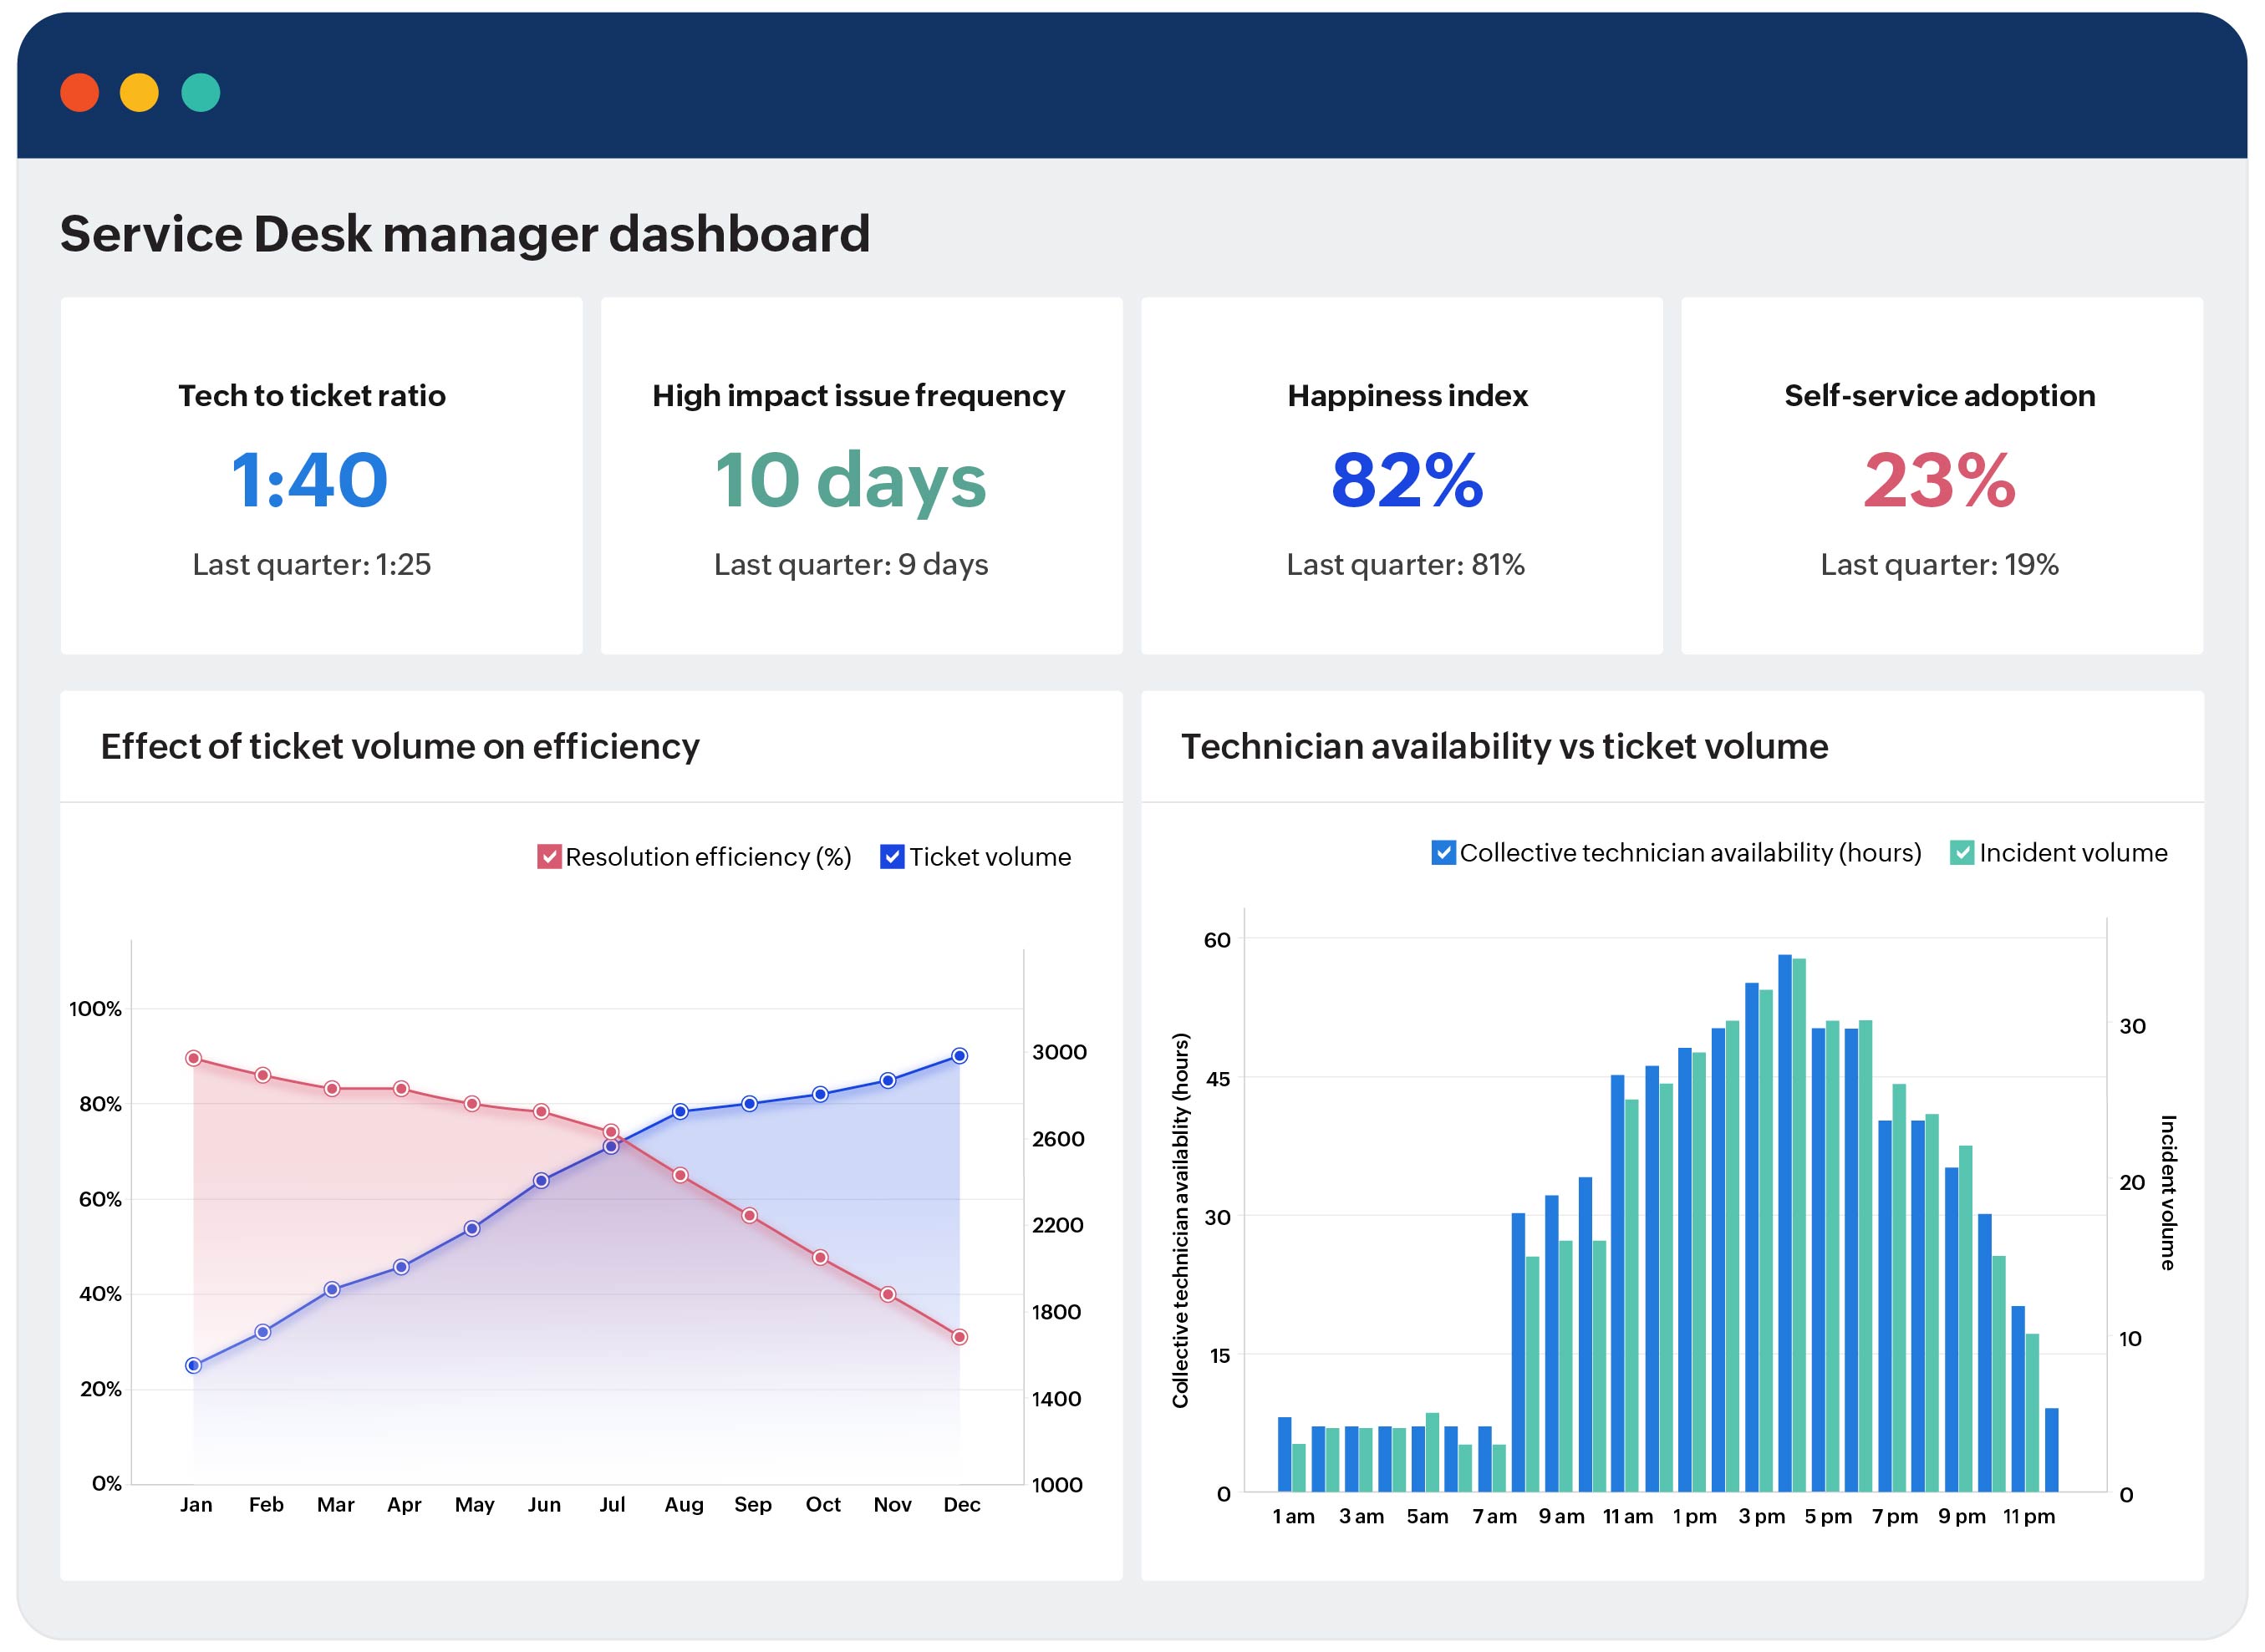
View the volume and performance trends
See details of key performance metrics and trends for first response, resolution and handling times etc. for agents and teams.
Measure the quality of your support
Measure customer satisfaction and understand good and not-so-good experiences

How well are your bots performing
Understand effectiveness and areas of issues in your automation services

Understand how your support issues are being handled
Ticket Management Performance
- Key performance indicators give you the snapshot of tickets in different stages
- View support volumes, trends and their distribution across your channels
- Surface details like first response times, average handle times as well as adherence to your SLA metrics
- Understand how your automations and chatbots are helping off-load your agents
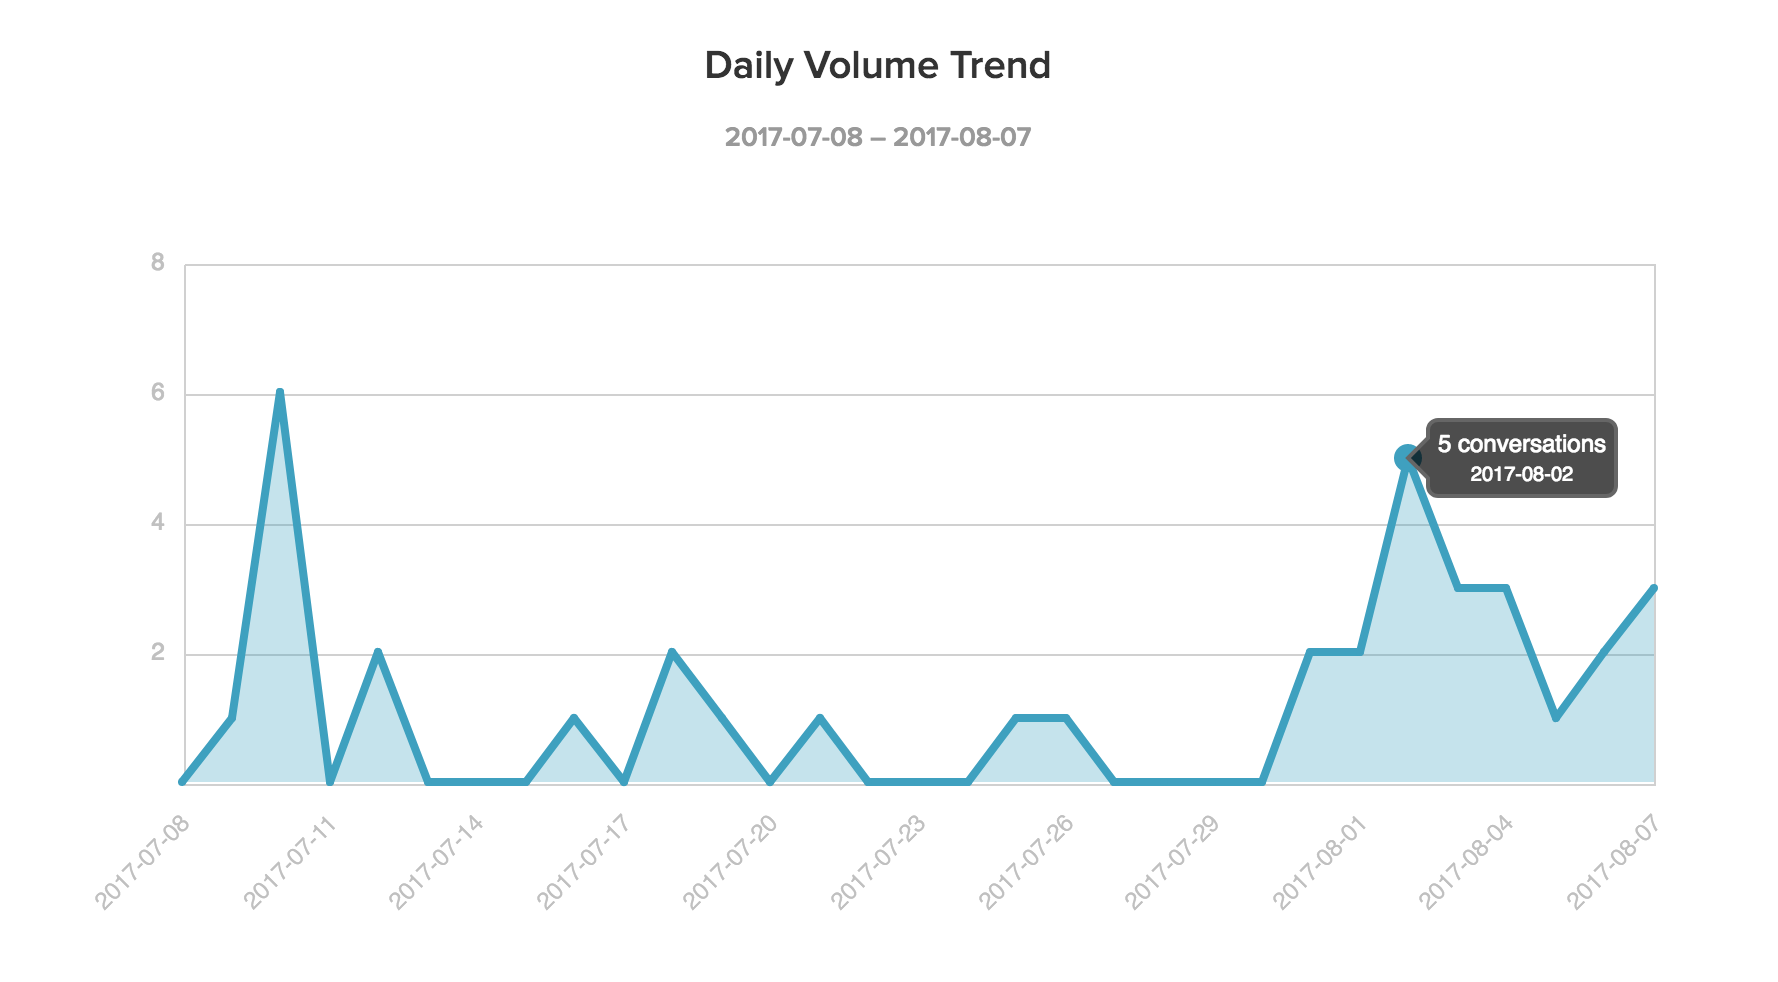
Measure conversational details across all channels
Conversation & Message Analytics
- Understand where and when your customers are coming for support
- Get deep insights into the conversational details – wait times, volumes of messages etc.
- Is your automation and self-service effective? What issues are getting handed off to the agents
- Review messaging performance including pending and response times, messages sent/received etc.
Manage agents and team performance to improve service quality
Agent & Team Performance
- Get an overview snapshot of your team performance across the key support metrics
- Compare individual agent performances to identify strengths and weaknesses
- Identify performance trends by viewing handling metrics over selected time periods
- Use the SLA adherence data to measure team and agent compliance with your standards
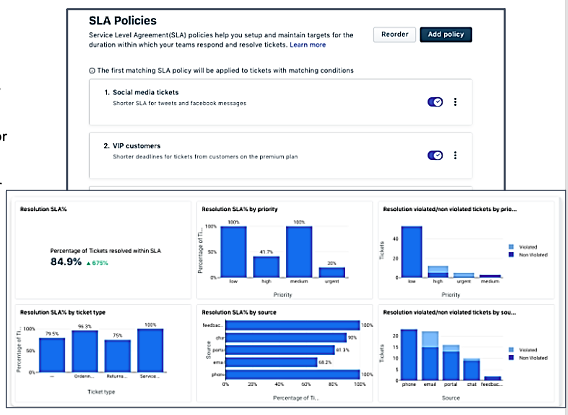
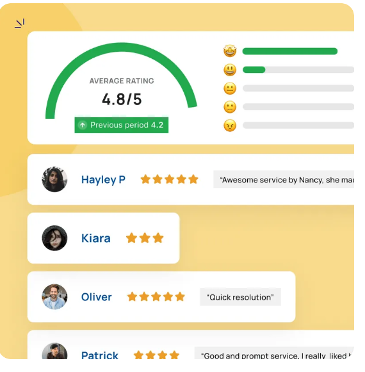
Measure support quality and customer satisfaction
Customer Satisfaction Dashboard
- Use CSAT scores, sentiment scores and feedback analysis as pulse of customer satisfaction
- Attribute survey results to brands, agents, teams and intents to correct areas of weakness
- Survey activity, performance and answers level data provide insights on your survey processes
- Associate satisfaction with type of customer inquiry can help you improve support delivery
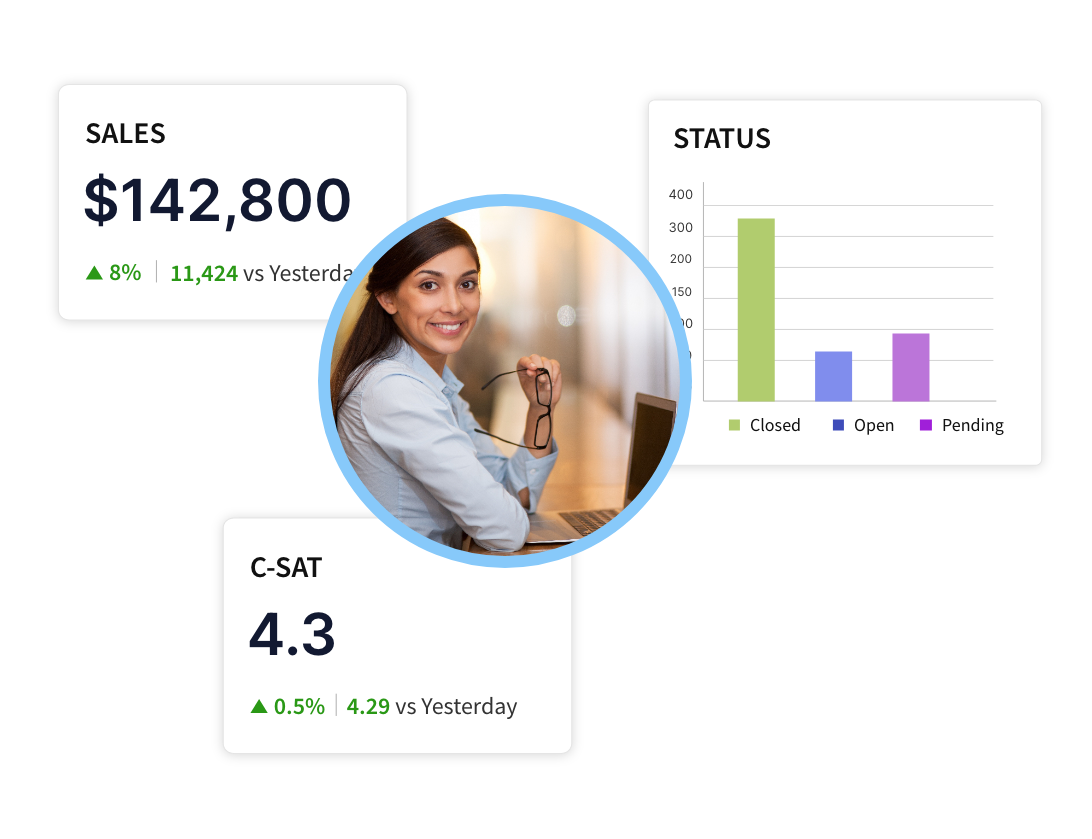
Which support interactions close sales and generate revenue?
Revenue Statistics
- Identify and track revenues brought in by your (human and automated) customer support
- Identify and drill into interactions that drive sales revenues
- Attribute revenues to agents and teams to build loyalty and reward success
- Provide tools and create strategies for your support operations to improve impact on sales
Run or have delivered regular curated reports
On-Demand & Scheduled Reports
- Select and run from a family of curated reports
- Schedule reports to be delivered via email to your and key stakeholders
- All date/times are localized for your region
- Print reports or export details to excel
Comprehensive data insights to drive your business value
Comprehensive data insights to drive your business value
Data Analytics Platform
- Platform consolidates support data with customer details and data from external sources
- Use Real-time and historical data to understand trends and areas requiring improvement
- Understand your human and automated service quality to strike the right balance
- Keep stakeholders informed by scheduling and sharing reports and dashboards
Extensive operational data on all aspects of your service
Ticket is created for every request and data for first response, SLA adherence, status duration, wait times, resolution etc. collected
Details of each conversation session from originating channel, number of messages, wait and pending times
Customer supplied data; journey details plus extended via integrations is available for use in outbound messaging
Measure quality of service delivery with customizable survey forms and rules-based sending
Conversation handling by agents, assignment, waiting times etc. details for human delivered support
Data for automated rules- based actions and chatbot handling of requests, resolutions and revenue generations
Data to identify the effectiveness, gaps and quality of your stored know how
AI analytics including intent detection success and misses, response and prompt actions, recommendations & assistance


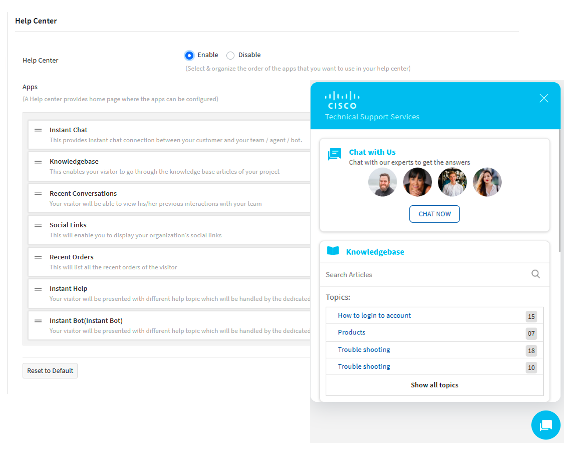
Understand the quality, utilization and gaps in your stored know how
Knowledge Analytics
- Visualize your knowhow status –including reported gaps, ratings of likes/dislikes, search successes and user engagement
- Get reports of search failures to identify the missing information
- Use the top used results to improve and remove the unused documents
- Quality and completeness of stored knowhow impacts self-service and agent performances
Measure and place value of your automations
Run volumes, successful resolution, transfers
View performance statistics for all your active bots – number of runs, bot resolutions, hours saved, transfers to agents

Understanding Bot Operations
Constantly review effectiveness of bot understanding and the actions taken using detailed operational data

Assign hours saved and dollars earned by bots
Bots off-load work from agents and can provide self-help to customers, but much are they saving you, earning for you?

Data to analyze performance of each bot
Detailed analytical data for each bot gives you the information to identify drop-offs and interactions for improvement.

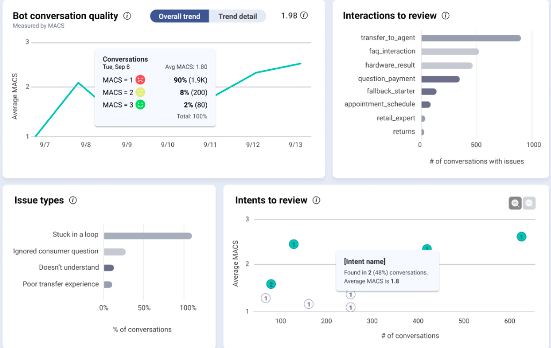
Get details of the conversational interactions –human and bot
AI & Conversational Intelligence
- Review the generated responses provided to queries for appropriateness and correctness
- Review the intent mapping of the customer queries – top queries and failures
- View and analyze the conversation- the message exchanges between customer and agents/bots
- Understand the top interactions and top failures and drill down to find the specific issues
Looking for help desk software? Try eServeCloud for free
Start your 30-days free trial with instant access
- No credit card required
- Instant setup
- 30-days free trial